

From a spreadsheet to a living 3D twin
A data center digital twin is a model of your room that answers "what happens if". DC Sim builds one from a single Excel file: racks, devices, power chain, cables, cooling. Nine layers show the room from different angles, four modes take it from design to incident replay, and every number the engine estimates says so.
One canvas, one View menu
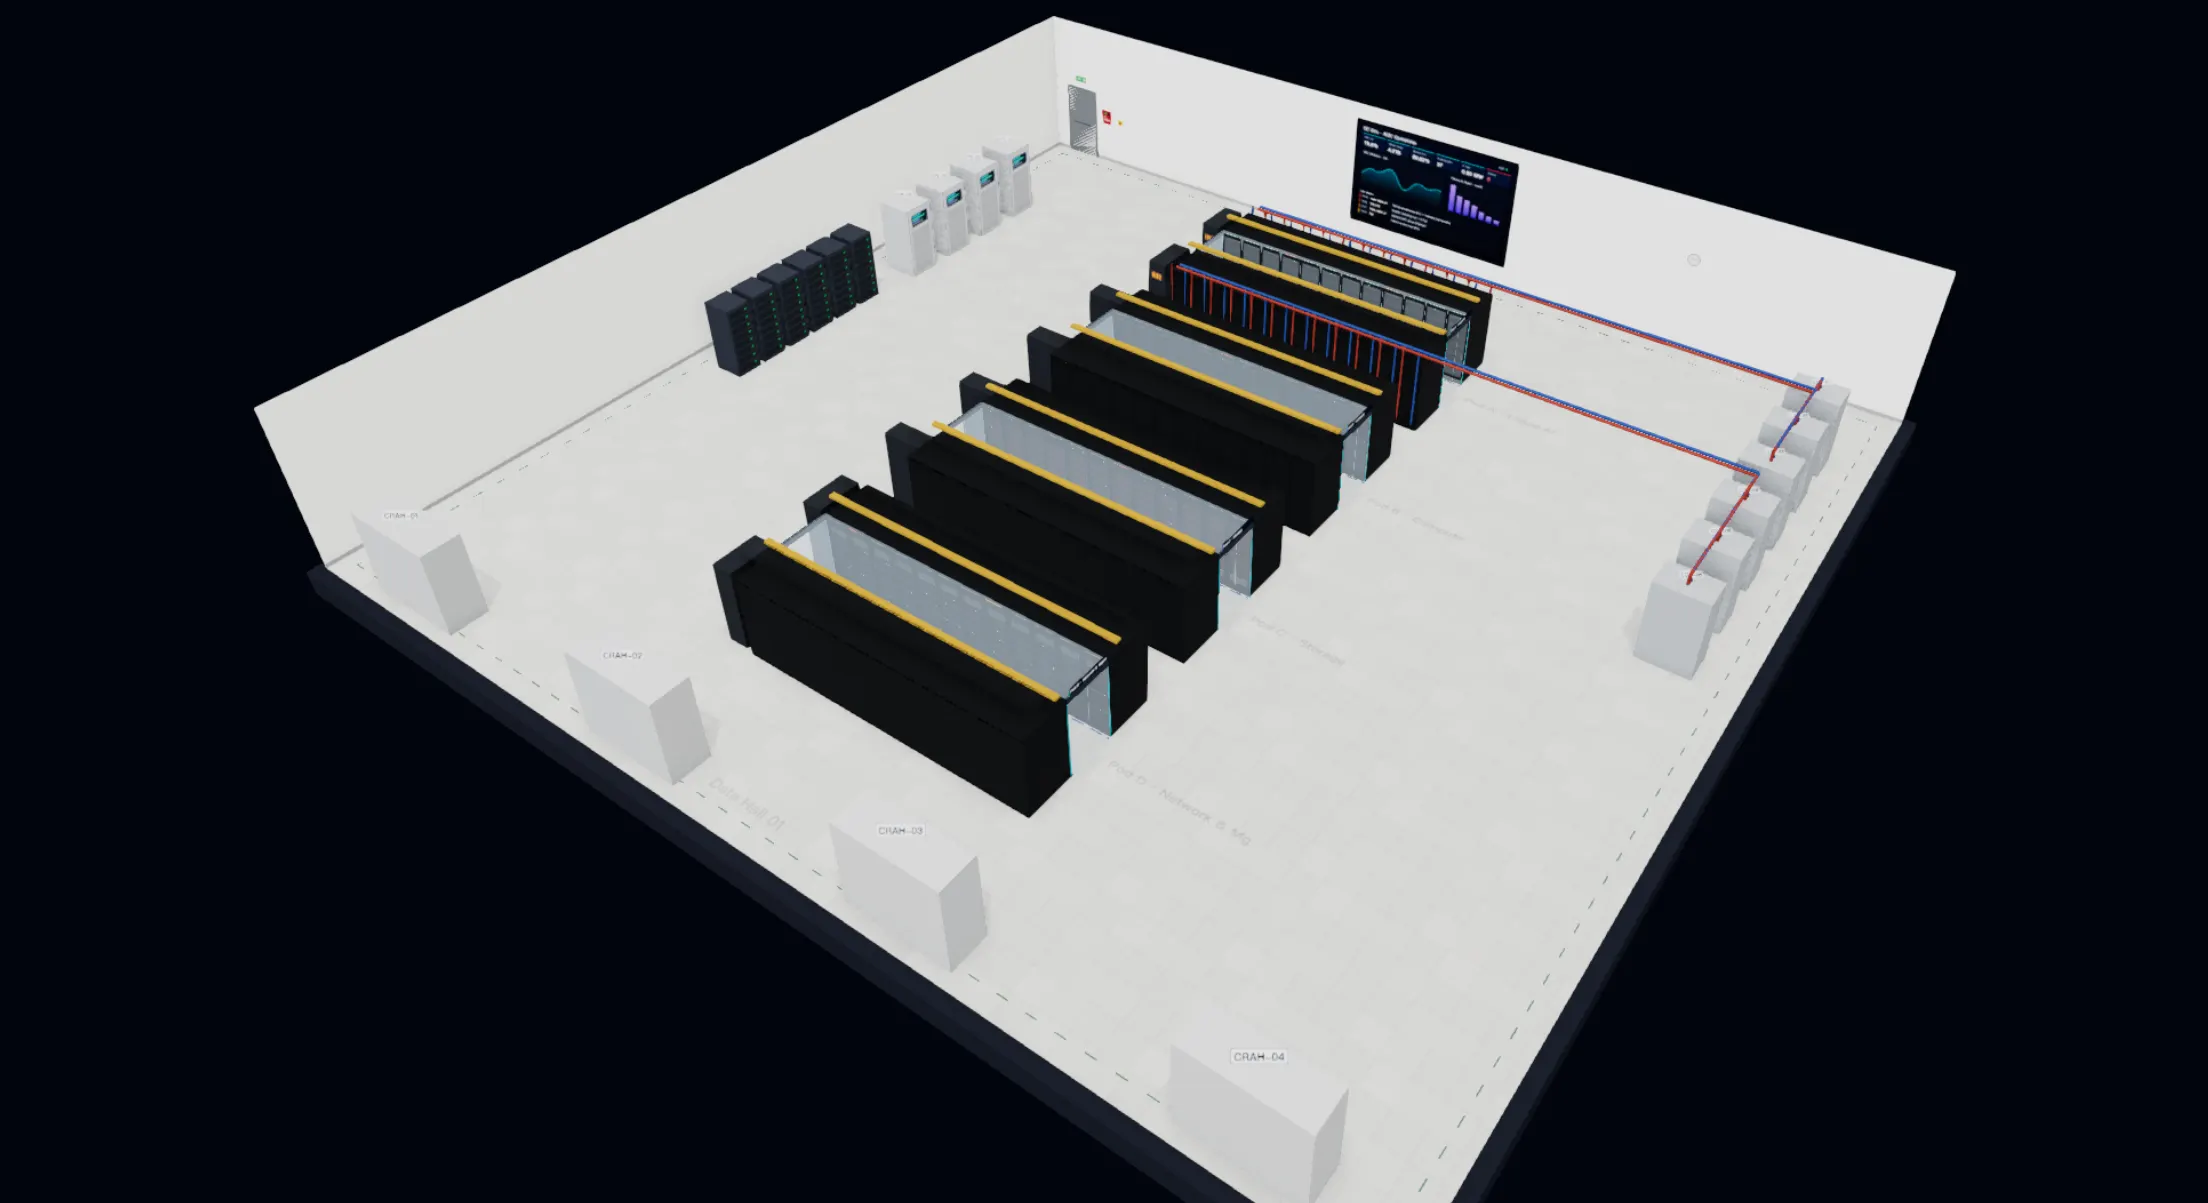
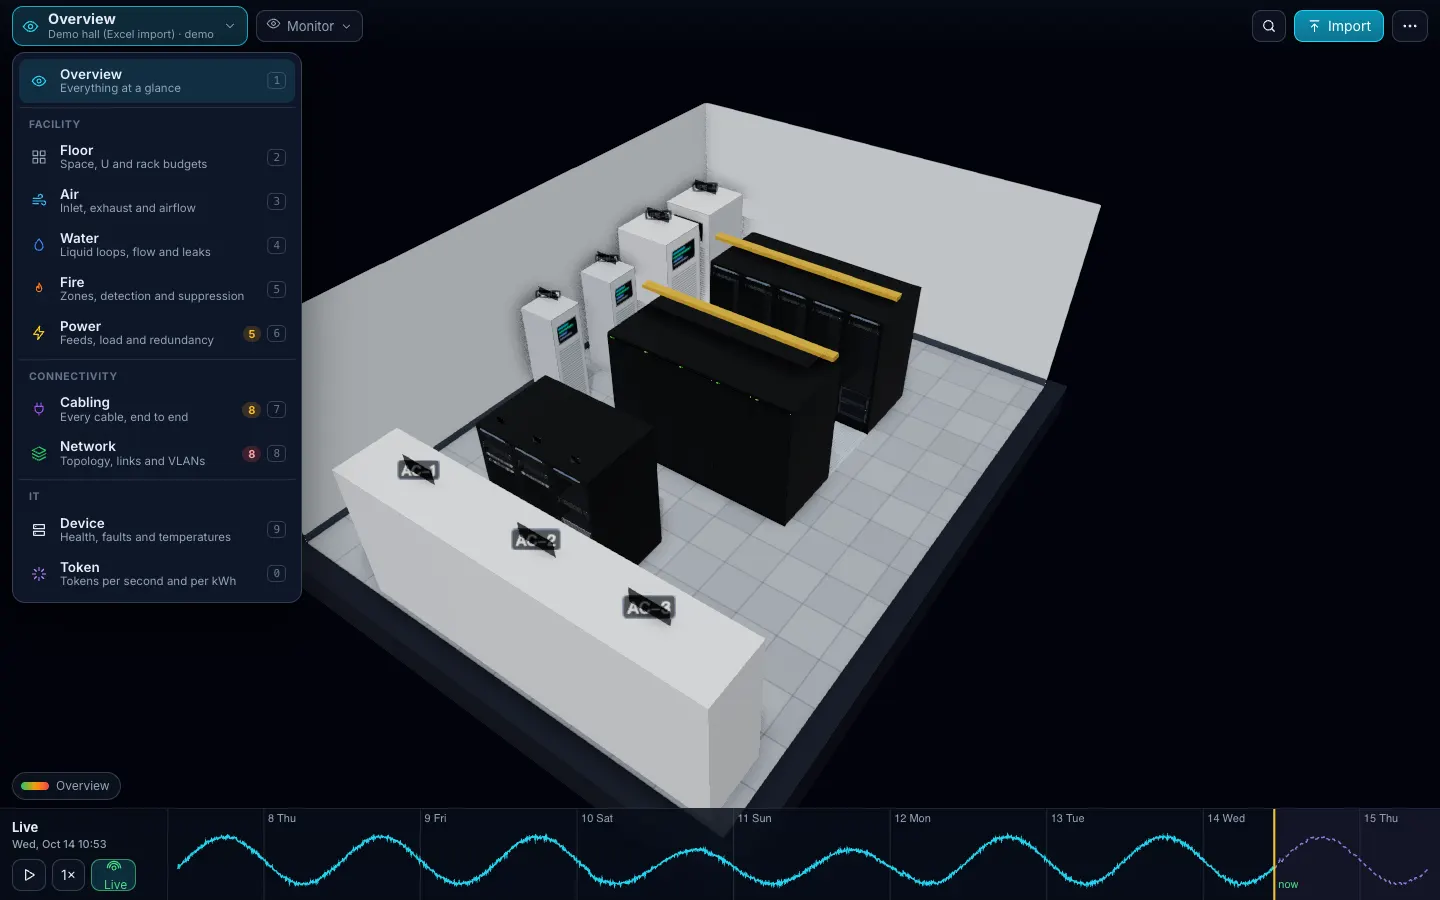
The whole screen is the room. A View menu switches the lens; a Mode menu changes what you are doing. A time slider scrubs the past week, live, or a 24-hour forecast. A legend, search, one primary button. Nothing else on screen at rest: six controls on a desktop, four on a phone.
Nine layers
| Group | Layers | What you see | What-if it answers |
|---|---|---|---|
| Facility (more) | Floor · Air · Water · Fire · Power | tiles, aisles, racks with U and kW budgets; inlet and exhaust temperature; coolant loops; fire zones; the power chain as a one-line diagram | Will it fit? A cooler stops: minutes to threshold (estimated). A leak: racks isolated. A fire: the suppression sequence. Any power node fails: what goes dark |
| Connectivity (more) | Cabling · Network | every cable routed in 3D; a topology laid out from the cables | Cut a cable; fail a switch or link: who loses every path |
| IT (more) | Device · Token | status, faults, LEDs; open and dissect any server; tokens per second and tokens per kWh | A fault on a part: workloads and tenants affected; tokens lost in any scenario |
Four modes, plus Import and Report
| Mode | Job | Highlights |
|---|---|---|
| Design | plan a room or a change | 2D plan; place, drag, rotate and delete racks and coolers; live design checks; N−1 resilience audit; publish as a version → Design mode |
| Monitor | daily operations | KPIs (IT kW, PUE, tokens/s, tokens per kWh, hottest inlet), alarms with advice, top token producers |
| Simulate | drills and capacity what-if | a scenario library generated from your model; custom fails; each run beside an untouched baseline → Simulate |
| Replay | incident forensics | the week’s critical and major alarms on the slider; export an incident log |
Import is always one click: Excel or CSV, preview, import report, change list on re-upload, template and example downloads. Export gives the model back as the filled template. Report gives energy, PUE, CO₂ and cost; tokens by workload, tenant, model and server; capacity runway; thermal; incidents; warranty. KPI values that come from the model rather than a sensor carry the estimated tag.
What-if, two speeds
Fail runs a fast graph propagation on the server: power failures darken devices, the network graph loses them, and the diagram, the 3D view and the banner update at once. Simulate it replays the same failure through the full simulator (batteries, generator start, thermal transients, breaker curves, tokens lost), so you see the timeline, not just the end state.
Lights on, lights off
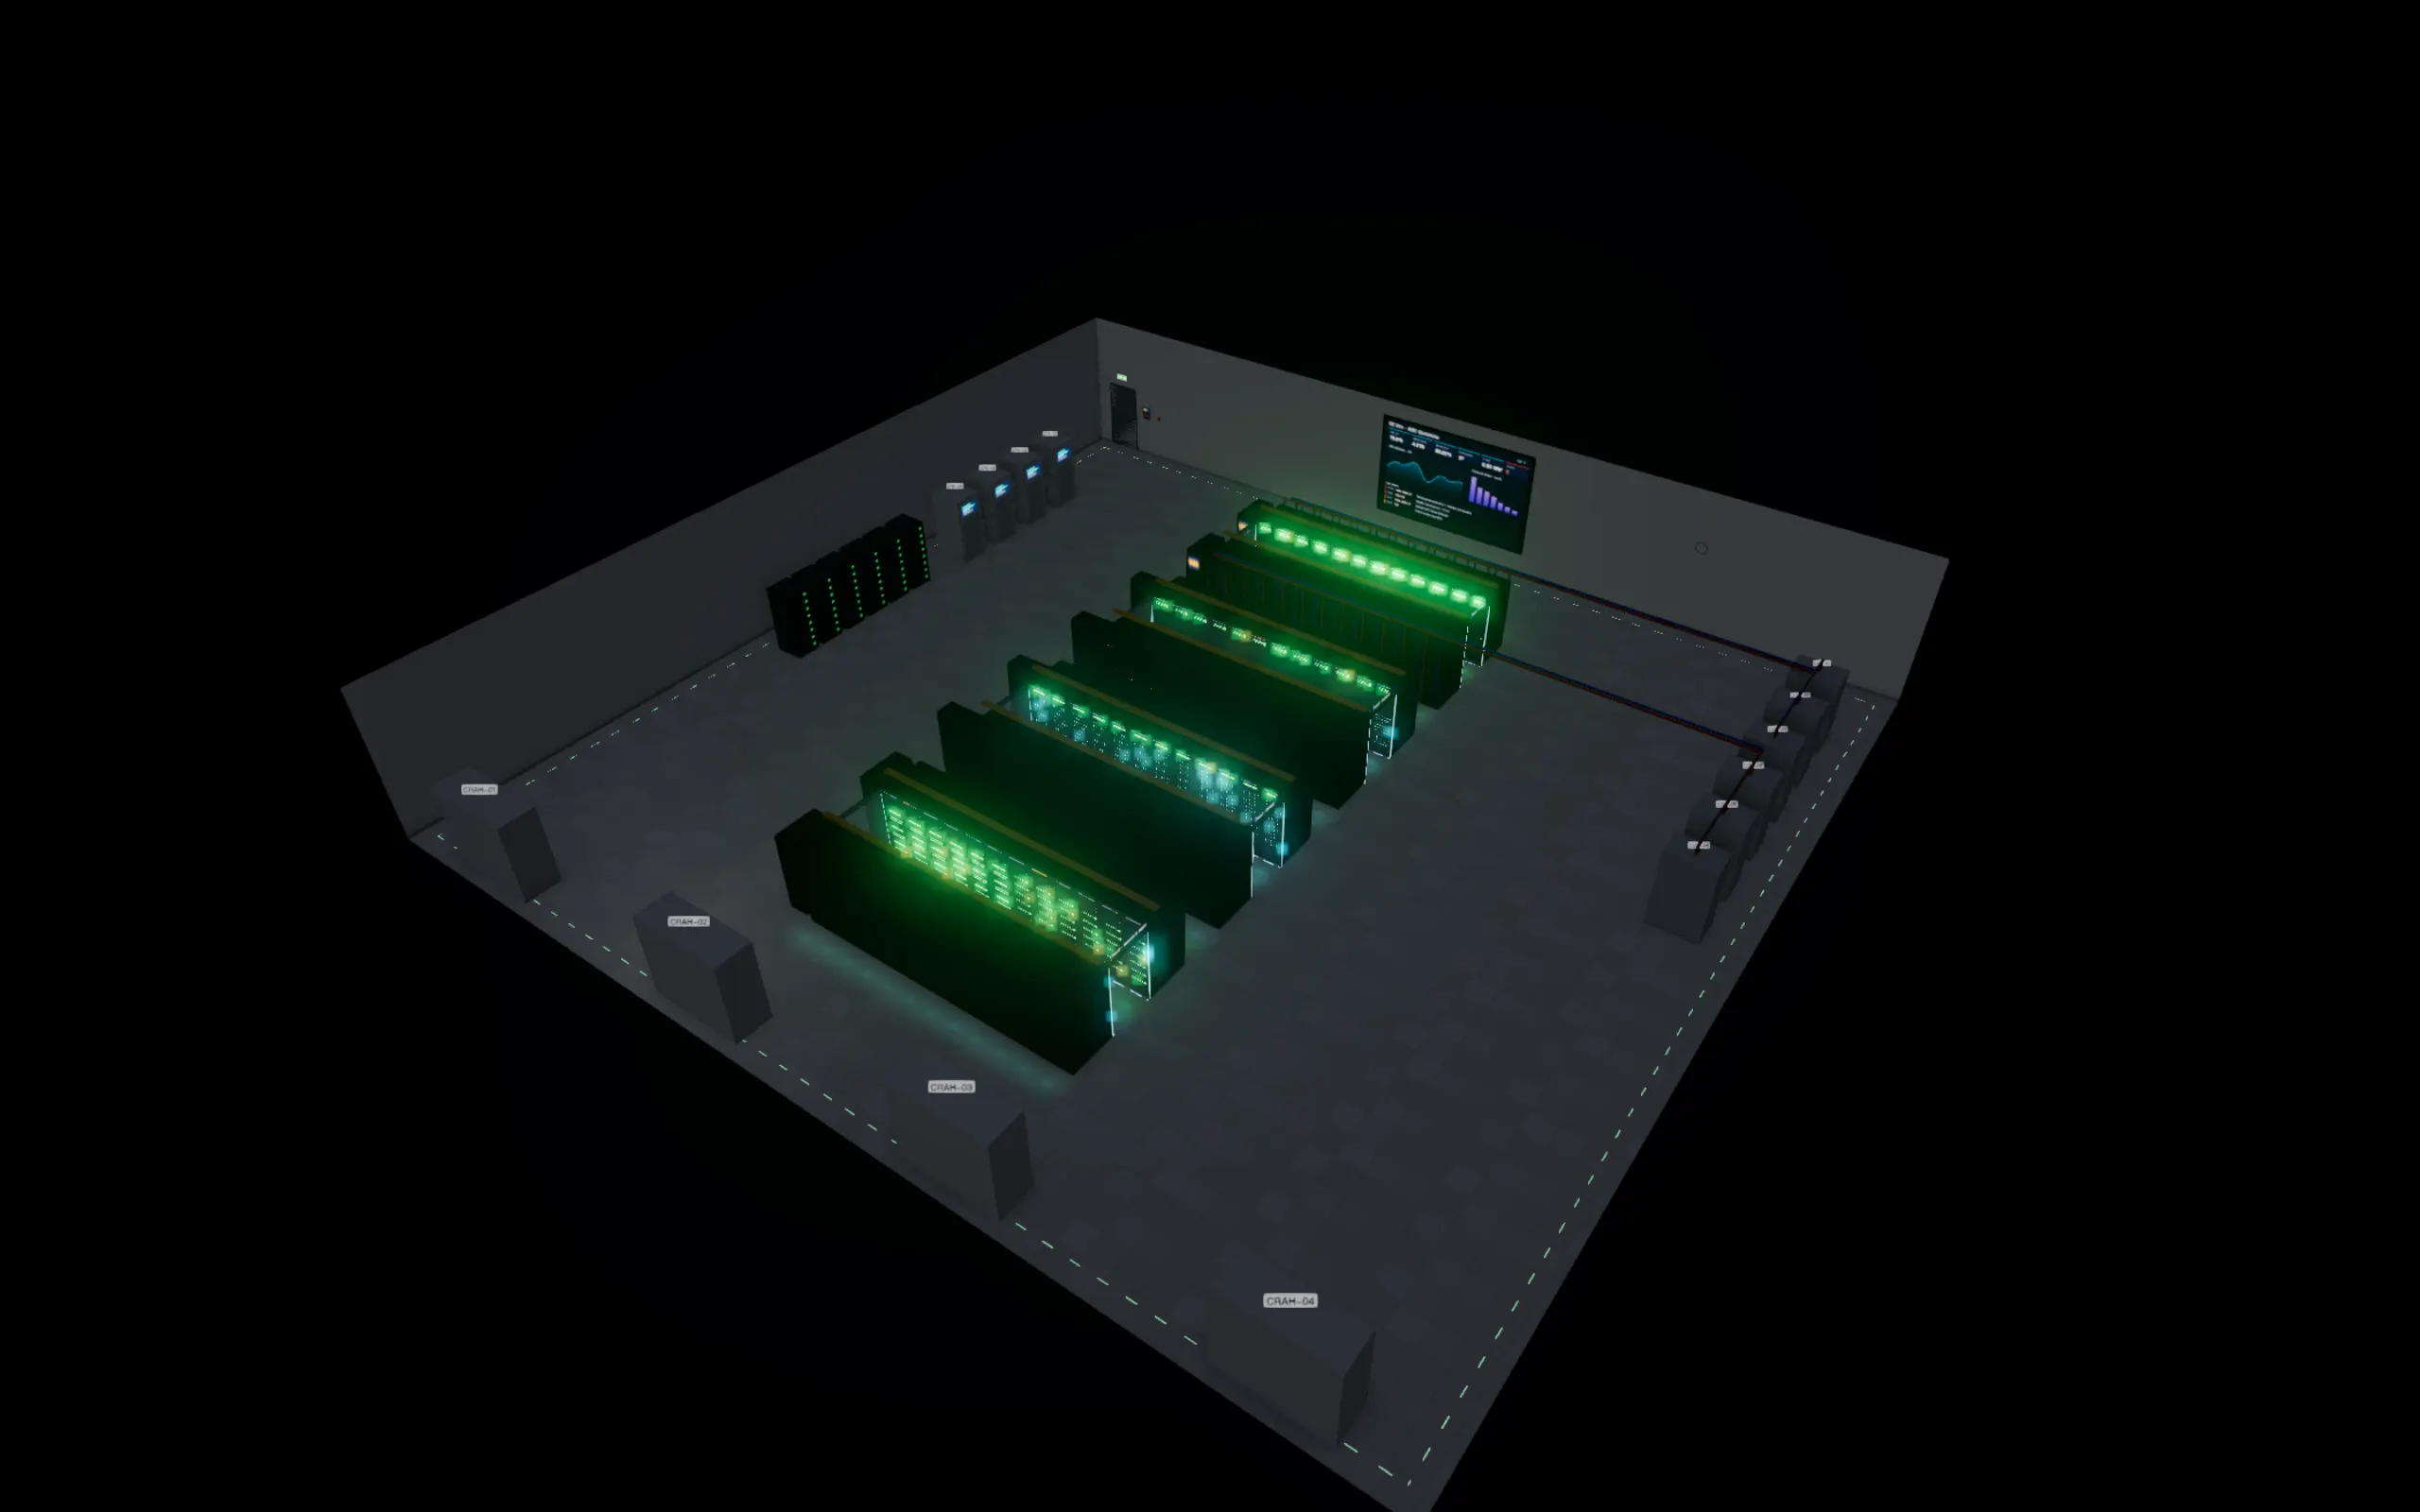
Press L, or pick Lights Off in the View menu, and the room goes dark the way a real hall does: what still glows is what is running. Every LED on a device front blinks with that device’s simulated load, screens and aisle strips stay lit, and devices that are off go dark. Auto switches the lights on a schedule, and the Power layer shows the lighting load and what the dark saves each month.
Built for honesty
- Zonal thermal and fluid models with “estimated” labels. Not CFD, and we never say it is.
- Defaults are marked assumed in the import report (2N A/B power, alternating aisles, one cooling zone) until you give real data.
- The simulation engine runs on the server; your browser receives frames. The importer never evaluates formulas or macros.
Two ways in
- Excel or CSV, available today: the Devices sheet is required, six more are optional. → the Excel template
- Zabbix and NetBox, available: paste a URL and a read-only token, press Test, preview, import. NetBox brings racks, devices, cables, power and VLANs; Zabbix brings readings and alarms. → Integrations
- Other monitoring tools Roadmap for live connectors; today any tool’s export fits the Readings sheet.
How long does the first twin take?
Minutes if your Devices sheet is ready: rack, U and model per row. The catalog fills in size, weight, power and parts for known models; unknown models become plain boxes marked "identify later".
What happens if my spreadsheet has errors?
Bad rows never block the import. Each skipped row is listed with its sheet, row and reason; checks like U overlaps, overweight racks and breakers over 80 % are pinned in 3D.
Can I use CSV instead of Excel?
Yes: the same sheets as CSV or TSV files (comma, semicolon or tab; UTF-8, UTF-16 or GBK). Up to 10 MB per file and 50,000 rows per sheet.
Does the twin update when my room changes?
Re-upload the file: devices are matched by serial, then name, then rack and U, and you get a change list before anything is applied. Connected Zabbix and NetBox sources re-sync the same way.
Is it a DCIM?
It sits on top of DCIM and monitoring rather than replacing them. It documents less and simulates more: the point is "fail this, see what goes dark", not asset accounting.
Pricing that fits a 10-rack room
Design
from $490 per project, one-time
Plan a room or a new row; three months per project. The AI design assistant comes at no extra cost when it ships.
Monitor
$5 per rack per month, min $49
The twin of a running room, with what-if and reports.
Partner
30 % margin
For integrators, MSPs and consultants.
One Excel file. Your room in 3D.
Download the import template (v1.3, nine sheets, only Devices required) and the filled example from our demo hall. No form, no email needed, no macros in the files.
Fill in the Devices sheet and send it with your walkthrough request; we import it on the call. What each sheet does