

UPS failure impact analysis in 20 minutes
A UPS failure impact analysis answers four questions for one UPS failing at peak load: which devices go dark, which keep running on one feed, which services stop, and which surviving node overloads. With a device list that records power cords and a sheet that maps the chain from utility to PDU, it takes about 20 minutes per UPS.
1. The four lists the analysis must produce
For each UPS, write down four lists. If one is missing, the analysis is not done.
- Dark: devices with no live power path left. Usually single-corded devices on the failed side, and dual-corded devices with both cords on one feed.
- On one feed: devices that survive without redundancy. They are fine until the next fault, which is often the work to fix the first one.
- Services stopped or degraded: a service stops when every device running it is dark, and is degraded when some are. This needs a “what runs here” column, not just hostnames.
- Overloads: every surviving node (UPS, panel, breaker, PDU) now above its rating, and every server whose remaining power supply cannot carry it alone.
A single point of failure in a data center is anything that puts a service on the first list.
2. Minutes 0–8: map the chain in two sheets
The DC Sim template uses these columns:
- Devices:
rack,u,model,name,power_cords(A, B or AB) andruns(services on the device, separated by semicolons). An emptyumeans not in a rack: the device is kept on an open shelf named byrack, so a switch on a desk still counts. - Power:
name,type(utility, generator, ATS, UPS, panel, breaker, PDU),rating(11 kVA, 16 A, 22 kW),fed_from,feed(A or B),rack,voltage,phases, and for each UPS eitherruntime_min(from the vendor’s runtime table) orbattery_kwh.
Add Cables of type power for exact PSU-to-outlet mapping. If your inventory already has rack, U and model, the eight minutes go on power_cords and fed_from. Walk the room for the racks nobody is sure about.
3. Minutes 8–12: read the checks before you fail anything
Import runs checks that find many single points of failure before any simulation:
- Single-corded devices on racks meant to be 2N.
- Same-feed devices: two PSUs, both on feed A.
- PDU or breaker over 80 % of its rating.
- UPS runtime under 5 minutes at current load. With no
runtime_min, nobattery_kwhand no catalog entry, runtime is estimated, and the check says so. - No PDU known for a rack: the power path is assumed. Fix the sheet first.
Fix the cheap ones now. Re-cording a same-feed server costs a maintenance window, not money.
4. Minutes 12–16: fail the UPS and do the room’s arithmetic
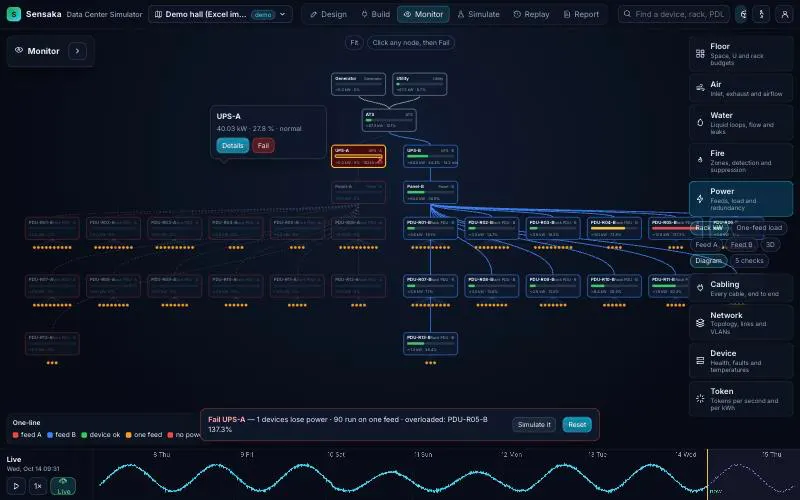
Open the Power view as a diagram, click UPS-A and press Fail. The banner reads “Fail UPS-A — [n] devices lose power · [n] run on one feed · stopped: [services] · overloaded: [node and %]”, and the 3D room darkens the same devices.
The overload line catches rooms that are 2N on paper only. One rack:
- Two 16 A PDUs at 230 V single-phase: 16 × 230 = 3.68 kW each. 80 % of that is 2.94 kW.
- The rack draws 4.0 kW, 2.0 kW per PDU: 54 % each. It looks healthy.
- Lose feed A and PDU-B carries 4.0 kW. 4.0 ÷ 3.68 = 109 % of its rating.
That rack was never 2N. To survive feed A, the whole rack must fit on one side under 80 %: 2.94 kW at most.
The same sum applies upstream: two 10 kW UPSes at 6 kW each become one UPS at 12 kW, which is 120 %. It applies per server too: 1,000 W on two 800 W supplies is 500 W each. On one feed, one supply must carry 1,000 W, and it cannot.
These are sums across racks and cords. That is why a rack-by-rack spreadsheet misses them.
5. Minutes 16–20: add time
Fail is instant, and exact for the chain you described. It does not say when things happen.
Runtime on the survivor. The surviving UPS now carries both sides. If the utility drops before the failed unit is back, its batteries run at that load. The diagram shows load % and runtime per UPS after the fail. Runtime comes from your runtime_min, else battery_kwh, else the catalog’s runtime table for that model, else it is estimated. A first-order check: minutes ≈ usable kWh × 60 ÷ load in kW. 2 kWh at 4 kW is 2 × 60 ÷ 4 = 30 minutes. At 8 kW it is 15, and less in practice, because batteries deliver less energy at high discharge rates.
Simulate it replays the failure on a timeline next to an untouched baseline: batteries, generator start, breaker trip curves, thermal transients and, for GPU nodes, tokens lost. A breaker at 109 % does not trip at once. Its trip curve decides when, and the timeline shows it (estimated). Temperatures come from a zonal model, not CFD.
6. Turn the lists into a fix list, cheapest first
- Move the second cord of every same-feed device to the other feed.
- Give single-corded devices a second path: a rack transfer switch, or dual-corded hardware.
- Rebalance racks so either side carries the whole rack under 80 %.
- Rebalance UPS load so either UPS carries both sides.
- Add battery if the survivor’s runtime is shorter than generator start plus a margin.
- Add capacity last: a PDU, a breaker, a UPS.
Re-upload after each change, read the change list and fail again. You are done when the dark list is empty.
7. Then fail everything else
Repeat for each PDU, panel and breaker. The scenario library already has lose feed A at peak, UPS failure, utility loss and generator fails to start. Then fail the switches in the Network view. Failures propagate from power to network, so a server that keeps its power can still lose every path if both of its switches hang off feed A.
Make it a drill: before every maintenance window, not during one.
What is a UPS failure impact analysis?
For one UPS failing at peak load, it lists the devices that go dark, the devices left on one feed, the services that stop and the nodes that overload on the surviving side. You do it once per UPS.
How is it different from a UPS runtime calculation?
Runtime says how long the batteries last when the utility fails. Impact analysis says what stops when the UPS itself fails. The survivor's runtime is part of the second.
What is a single point of failure in a data center?
Any one component whose failure stops a service: a single-corded server, two PSUs on one feed, one switch, a PDU that cannot carry the whole rack. Redundant hardware wired to one path is still a single point of failure.
Do I need live monitoring to do this?
No. The chain and the cords come from a spreadsheet. Measured watts improve the loads, and DC Sim takes them today from a Readings sheet exported from your monitoring. Live connectors through an outbound agent are on the roadmap.
How accurate is the result?
What goes dark is exact for the chain you describe: one cord on feed A means dark when A fails. Loads are estimated per model unless you import readings. Runtime and thermal figures are estimated and labelled.
One Excel file. Your room in 3D.
Download the import template (v1.3, nine sheets, only Devices required) and the filled example from our demo hall. No form, no email needed, no macros in the files.
Fill in the Devices sheet and send it with your walkthrough request; we import it on the call. What each sheet does